TechnoEdge

Free Master Class

How to Plan Your AI Training Budget for FY26? (For CHROs & L&Ds)

AI-Driven Decision Making

Enterprise AI transformation roadmap in 2026 showing Microsoft Fabric architecture, unified OneLake storage, Power BI dashboards, AI workflow integration, governance controls, and workforce reskilling phases.
blogs

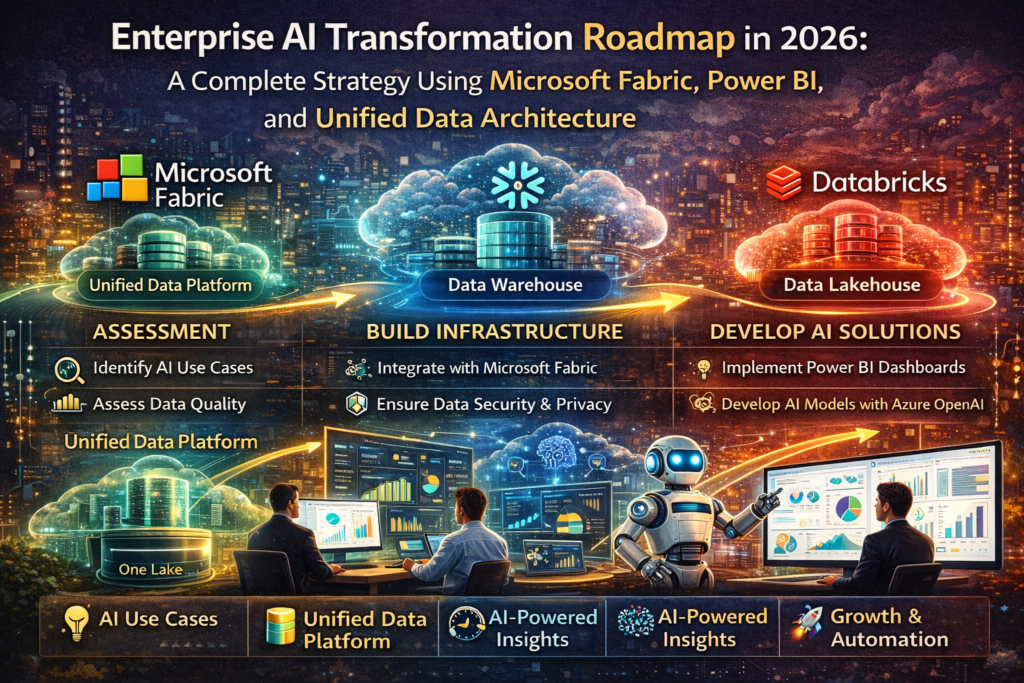
Enterprise AI Transformation Roadmap in 2026: A Complete Strategy Using Microsoft Fabric, Power BI, and Unified Data Architecture

Introduction: AI Transformation Is Not About Tools It Is About Architecture and Culture In 2026, almost every enterprise says it is “doing AI.” But very few organizations are truly AI-transformed. Many companies deploy AI chatbots. Some experiment with predictive dashboards. Others integrate Copilot into Power BI. However, isolated AI adoption does not equal transformation. True enterprise AI transformation requires: Artificial Intelligence is not a feature.It is a structural shift in how organizations operate. This article provides a complete enterprise roadmap for AI transformation using modern platforms such as Microsoft Fabric and Power BI. Phase 1: Data Foundation Modernization Before AI can deliver value, data must be structured, accessible, and reliable. Many enterprises still operate in siloed environments where: AI built on fragmented data produces unreliable outcomes. The first phase of transformation is consolidating data into a unified architecture. Platforms like Microsoft Fabric enable centralized storage through OneLake and lakehouse design. During this phase, enterprises must: Without this foundation, AI adoption will create more confusion than clarity. Phase 2: Business Intelligence Modernization Once the data foundation is stable, enterprises must modernize reporting systems. Traditional static dashboards must evolve into dynamic, real-time insight platforms. Power BI integrated within Fabric allows: This phase shifts organizations from descriptive reporting to predictive awareness. The goal is to reduce decision latency and build trust in unified analytics. Phase 3: AI Integration into Core Workflows After BI modernization, enterprises begin embedding AI into operational workflows. Examples include: At this stage, AI is no longer experimental.It becomes embedded in daily operations. Microsoft Fabric supports this by integrating data pipelines, AI workloads, and reporting within a single environment. The transformation here is operational, not cosmetic. Phase 4: Governance, Compliance, and Responsible AI As AI becomes embedded in decision-making, governance becomes critical. Enterprises must establish: Ignoring governance creates reputational and legal risk. AI transformation must include ethical safeguards. Platforms like Fabric simplify governance implementation through centralized controls, but leadership accountability remains essential. Phase 5: Workforce Reskilling and Cultural Adoption Technology alone cannot transform enterprises. Employees must be trained to: Resistance to AI often stems from fear of replacement. Successful transformation communicates augmentation rather than replacement. Data analysts evolve into AI-augmented strategists.Engineers evolve into AI workflow architects. Cultural readiness defines transformation success. Phase 6: Continuous Optimization and Strategic Scaling AI transformation is not a one-time project. Enterprises must continuously: Scalability becomes the defining factor. Unified platforms reduce operational complexity and support long-term growth. Transformation becomes sustainable only when optimization is ongoing. Why Many AI Transformations Fail Many enterprises fail because they: AI transformation requires structured progression. Skipping phases creates instability. Measuring AI Transformation Success Enterprises should measure success not only by technology adoption but by business outcomes. Key indicators include: Transformation must produce measurable value. Frequently Asked Questions (Expanded and Detailed) How long does enterprise AI transformation typically take? AI transformation timelines vary significantly depending on organization size and complexity. Smaller enterprises may see early results within a year, while large enterprises may require multi-year phased strategies. The process involves architectural redesign, cultural change, and governance implementation, which cannot be rushed without risk. Is Microsoft Fabric necessary for AI transformation? Fabric is not mandatory, but unified platforms simplify transformation significantly. Fragmented environments increase integration complexity and cost. Fabric offers architectural consolidation that supports scalable AI adoption. Can enterprises adopt AI without modernizing data architecture? Technically possible, but strategically risky. AI built on fragmented or inconsistent data leads to unreliable outcomes. Foundation-first transformation is essential. What is the biggest risk during AI transformation? The biggest risk is overestimating AI capability while underestimating governance and cultural resistance. Balanced implementation is critical. Does AI transformation reduce workforce size? AI often augments roles rather than eliminating them. Repetitive tasks decrease, while strategic roles increase. Reskilling determines impact. Final Conclusion Enterprise AI transformation in 2026 is not about deploying tools. It is about redesigning how organizations think, operate, and decide. The roadmap includes: Platforms like Microsoft Fabric and Power BI enable transformation but leadership and strategy define success. Organizations that approach AI transformation structurally gain long-term competitive advantage. Professionals who understand transformation frameworks gain strategic career leverage.  Build Enterprise AI Expertise with TechnoEdgels For structured, deep insights on: Stay aligned with the future of enterprise AI and analytics strategy.

Enterprise analytics dashboard using Power BI and Microsoft Fabric showing cost optimization, predictive insights, AI anomaly detection, unified OneLake architecture, and productivity metrics.
blogs

Real Corporate Case Studies in 2026: How Power BI and Microsoft Fabric Reduced Costs, Improved Productivity, and Transformed Enterprise Operations

Introduction: Why Modern Enterprises Use Analytics for Cost Control — Not Just Reporting For many years, business intelligence tools were used primarily for visibility. Companies built dashboards to understand sales performance, track revenue trends, and monitor KPIs. While these insights were helpful, analytics was often reactive. It explained what had already happened. In 2026, the role of analytics inside enterprises has evolved dramatically. Power BI, deeply integrated within Microsoft Fabric, has become part of a strategic cost and productivity engine. Enterprises now use unified analytics platforms to identify inefficiencies early, optimize resource allocation, automate decision-making workflows, and reduce operational waste. This shift is not about prettier dashboards. It is about structural optimization. Organizations that successfully integrate Microsoft Fabric with Power BI are not only seeing improved reporting. They are experiencing measurable financial impact. Let us explore this transformation through detailed corporate scenarios. Case Study 1: Global Manufacturing Firm Reducing Supply Chain Costs Through Unified Analytics A multinational manufacturing enterprise faced persistent supply chain volatility. Inventory levels fluctuated unpredictably, transportation costs were rising, and vendor reliability varied across regions. The company previously relied on a traditional warehouse system that produced weekly summary reports. These reports showed cost overruns but did not identify root causes in time. After implementing Microsoft Fabric, the organization centralized all procurement, logistics, and production data into OneLake. Real-time shipment tracking data, vendor delivery metrics, and inventory movement were integrated into a unified lakehouse architecture. Power BI dashboards were rebuilt to show real-time visibility into: AI-powered anomaly detection inside Fabric identified recurring delivery delays tied to specific geographic routes. Predictive models forecasted potential inventory shortages based on historical demand patterns. Instead of reacting to shortages, the company proactively adjusted procurement schedules and renegotiated supplier contracts. Within twelve months, transportation costs dropped significantly. Excess inventory was reduced. Production downtime decreased because raw materials were better aligned with demand forecasts. The cost reduction was not achieved through layoffs. It was achieved through system-level insight. Case Study 2: Retail Enterprise Transforming Inventory and Margin Management A retail organization operating hundreds of stores struggled with inconsistent margins across regions. Overstocking of slow-moving products led to heavy discounting, while high-demand products frequently went out of stock. Legacy reporting systems provided historical data but lacked predictive capability. After migrating to Microsoft Fabric, the company integrated point-of-sale transactions, customer behavior data, and supply chain inputs into a unified architecture. Power BI dashboards were enhanced with AI-generated trend analysis. Copilot-generated executive summaries highlighted performance gaps automatically. AI-driven forecasting models predicted seasonal demand shifts with higher accuracy. Store managers no longer relied solely on intuition. They received automated recommendations for inventory rebalancing and pricing adjustments. Within a year, markdown losses decreased substantially. Inventory turnover improved. Profit margins stabilized across multiple regions. The key factor was predictive insight combined with unified architecture. Case Study 3: Financial Services Organization Enhancing Risk and Compliance Efficiency In the financial sector, compliance and risk monitoring are resource-intensive operations. A financial services company faced rising compliance costs due to manual transaction reviews and regulatory audits. Traditional warehouse reports provided historical compliance metrics but lacked real-time anomaly detection. By adopting Microsoft Fabric, the firm integrated transactional data, audit logs, and compliance indicators into a centralized environment. AI algorithms analyzed transaction patterns continuously. Power BI dashboards displayed dynamic risk scores for different business units. Copilot-generated summaries allowed compliance officers to understand anomalies quickly without manually reviewing raw data. Manual review workloads decreased significantly. Regulatory reporting became more streamlined. Risk detection accuracy improved. Compliance costs dropped because fewer human hours were required for manual oversight. This example demonstrates how unified analytics directly impacts operational expense. Case Study 4: Healthcare Network Improving Workforce and Resource Allocation A healthcare network operating multiple hospitals faced rising operational costs due to unpredictable patient inflow and inefficient staff allocation. Without integrated data systems, administrators relied on delayed reports to make staffing decisions. By implementing Microsoft Fabric, patient admissions data, emergency room logs, and staffing schedules were unified. AI-driven predictive models identified peak admission patterns based on historical trends and seasonal indicators. Power BI dashboards allowed administrators to adjust staffing schedules proactively. Overtime expenses decreased. Patient wait times improved. Staff satisfaction increased due to better scheduling alignment. Operational efficiency improved not because more resources were added, but because existing resources were used more intelligently. Structural Advantage: Why Unified Architecture Drives Measurable Results The common thread across these case studies is architectural integration. Traditional warehouse environments often create data silos. Moving data between systems introduces delays and inconsistencies. Microsoft Fabric reduces fragmentation by unifying storage, engineering, AI, and reporting into a single ecosystem. This reduces: Power BI becomes the presentation layer of a deeply integrated system rather than a disconnected reporting tool. This structural coherence drives sustainable cost reduction. Why Productivity Improves Alongside Cost Reduction Cost reduction and productivity improvement often occur together. When AI automates repetitive tasks such as anomaly detection and trend identification, employees can focus on strategic decision-making. When dashboards provide real-time visibility, managers act faster. When predictive analytics forecasts problems early, operational disruptions decrease. Productivity improves because friction is removed from workflows. Frequently Asked Questions   Are these types of cost reductions achievable for most enterprises, or only large corporations? Cost optimization through unified analytics is achievable across enterprise sizes, but the scale of impact varies. Large corporations often experience more visible financial reductions due to higher operational complexity. However, mid-sized organizations can also benefit significantly, especially in areas like inventory management and workforce optimization. The key factor is not company size, but the quality of implementation and data maturity. Does implementing Microsoft Fabric automatically guarantee ROI? No technology guarantees return on investment automatically. ROI depends on strategic alignment, data quality, governance frameworks, and employee adoption. Organizations that treat Fabric as a transformation initiative rather than a simple software upgrade are more likely to realize measurable benefits. How long does it typically take to see measurable improvements? Short-term efficiency gains can sometimes be observed within months, particularly when addressing obvious inefficiencies. However, full-scale transformation involving predictive analytics and

Trust Us, One Call Can Make a Difference
Please enable JavaScript in your browser to complete this form.
Join As Trainer
Join As Trainer
Please enable JavaScript in your browser to complete this form.
Download Course Content
Please enable JavaScript in your browser to complete this form.
More than 5 People are attending Get On a Call with Us
Please enable JavaScript in your browser to complete this form.
More than 5 People are attending Get On a Call with Us
Scroll to Top