

TechnoEdge

Free Master Class

How to Plan Your AI Training Budget for FY26? (For CHROs & L&Ds)

Power BI 2026

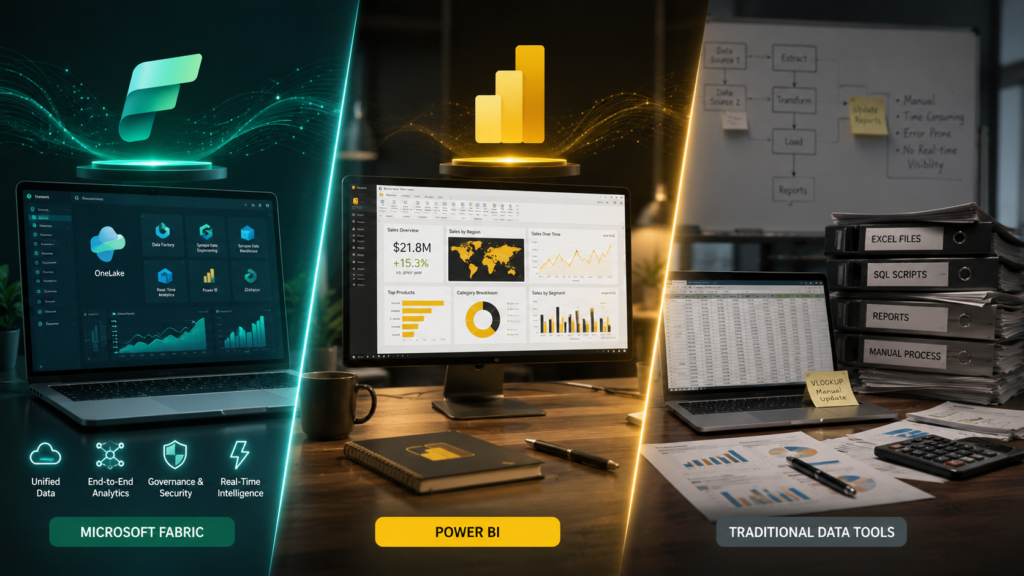
Comparison of Microsoft Fabric, Power BI, and traditional data tools displayed on modern business analytics dashboards in a corporate technology environment.
blogs

Microsoft Fabric vs Power BI vs Traditional Data Tools: What Companies Are Actually Using in 2026

Introduction: The Analytics Industry Is Going Through a Massive Transformation For many years, businesses relied on traditional reporting tools, spreadsheets, disconnected databases, and manual dashboards to manage their analytics workflows. These systems helped organizations generate reports and track business performance, but they were built for a very different era. In 2026, the business world has changed dramatically. Companies now generate massive amounts of data every second from: This explosion of data has created a major challenge for organizations:👉 Traditional analytics systems can no longer handle modern business complexity efficiently. As a result, companies are rapidly shifting toward: This is where platforms like: have become central to enterprise transformation strategies. But many professionals and organizations still feel confused about: This blog will give you a complete, practical, and business-focused understanding of the modern analytics landscape. Understanding Traditional Data Tools (How Companies Worked Before Modern Analytics Platforms) Before cloud analytics and AI-driven systems became mainstream, companies relied heavily on traditional data tools and manual reporting environments. These typically included: For many years, these tools worked effectively because business operations were simpler and data volumes were manageable. Traditional reporting workflows often looked like this: Although this process worked in earlier years, modern businesses now face several major challenges with traditional systems. 1. Data Silos Create Operational Problems One of the biggest issues with traditional tools is fragmentation. Different departments often use separate systems for: This creates isolated data silos. As a result: Modern businesses need connected ecosystems rather than disconnected tools. 2. Traditional Systems Struggle with Real-Time Analytics Today’s businesses require: Traditional systems often rely on scheduled updates and manual refresh cycles, which creates delays. This slows business responsiveness significantly. 3. Scaling Traditional Analytics Infrastructure Is Expensive As organizations grow, their data infrastructure becomes increasingly complex. Traditional systems often require: This increases operational costs and reduces flexibility. What Is Power BI and Why It Became So Popular Worldwide Microsoft Power BI became extremely popular because it simplified business intelligence and data visualization for organizations of all sizes. Power BI allows companies to: without requiring extremely complex infrastructure. One of the biggest reasons Power BI gained massive adoption is:👉 accessibility. It allowed businesses to move away from static reporting toward interactive analytics. How Power BI Changed Business Intelligence Earlier, dashboards often required: Power BI simplified this process dramatically. Organizations could now: This made analytics more accessible to: rather than limiting it only to technical teams. Why Companies Still Use Power BI in 2026 Even with the rise of modern analytics ecosystems, Power BI remains highly relevant because: Many companies still use Power BI extensively for: However, modern business complexity is creating demand for something even larger:👉 unified analytics ecosystems. This is where Microsoft Fabric enters the picture. What Is Microsoft Fabric? (The Biggest Analytics Shift in the Microsoft Ecosystem) Microsoft Fabric is Microsoft’s next-generation unified analytics platform designed to combine: inside a single ecosystem. Instead of using multiple disconnected tools, organizations can manage everything in one platform. This is one of the biggest reasons Microsoft Fabric is gaining rapid enterprise adoption. Why Microsoft Fabric Is Different from Traditional BI Platforms Traditional analytics environments often require multiple separate systems for: Fabric combines these capabilities into a unified environment. This reduces: It creates a much more scalable and AI-ready architecture. Fabric Is Designed for the AI Era One of the biggest advantages of Fabric is its AI-first approach. Modern businesses increasingly require: Fabric is designed to support: This makes it highly attractive for future-focused enterprises. Microsoft Fabric vs Power BI: What Is the Real Difference? This is one of the most common questions professionals ask. The confusion happens because Power BI is actually part of the Fabric ecosystem. However, their roles are different. Power BI Focuses Mainly on Visualization and Reporting Power BI is primarily used for: It is extremely powerful for presenting and analyzing data visually. Microsoft Fabric Focuses on the Entire Data Ecosystem Fabric goes much further. It handles: This means Fabric is not replacing Power BI. Instead:👉 Power BI becomes part of a larger intelligent ecosystem inside Fabric. What Companies Are Actually Using in 2026 The answer depends on: Small and Mid-Sized Businesses Many SMBs still heavily rely on: because they need: Large Enterprises Large enterprises are increasingly moving toward: because they manage: Traditional Tools Are Not Fully Disappearing Traditional systems still exist in many organizations. However:👉 they are rapidly losing strategic importance. Most enterprise modernization roadmaps now focus on: Why AI Is Accelerating the Shift Toward Fabric and Modern Analytics Platforms AI is one of the biggest reasons companies are modernizing analytics infrastructure. Traditional systems struggle to support: Modern platforms like Fabric are built specifically for:👉 AI-powered business operations. This makes them future-ready. Career Opportunities in Microsoft Fabric and Power BI Are Growing Rapidly As companies modernize their analytics infrastructure, demand for skilled professionals is increasing rapidly. Modern roles include: These roles are becoming highly valuable because organizations need professionals who understand: Why Professionals Should Learn Both Power BI and Microsoft Fabric One of the biggest mistakes professionals make is treating these technologies as competitors. In reality:👉 they complement each other. Power BI remains critical for: Fabric expands capabilities into: Professionals who understand both will have stronger long-term career opportunities. How TechnoEdgels Helps Professionals Become Future-Ready Analytics Experts TechnoEdgels helps professionals and organizations prepare for the future of analytics and AI-driven business intelligence. Instead of teaching outdated reporting-only approaches, TechnoEdgels focuses on: The goal is not just certification. The goal is:👉 building future-ready analytics professionals. Frequently Asked Questions 1. Is Microsoft Fabric replacing Power BI completely? No, Microsoft Fabric is not replacing Power BI completely. In fact, Power BI is becoming part of the broader Microsoft Fabric ecosystem. Power BI continues to play a major role in visualization, dashboards, and reporting, while Fabric expands capabilities into data engineering, AI integration, cloud analytics, and enterprise-scale data management. Organizations will continue using Power BI extensively, but increasingly within larger unified analytics environments. 2. Are traditional data tools becoming outdated in 2026? Traditional tools
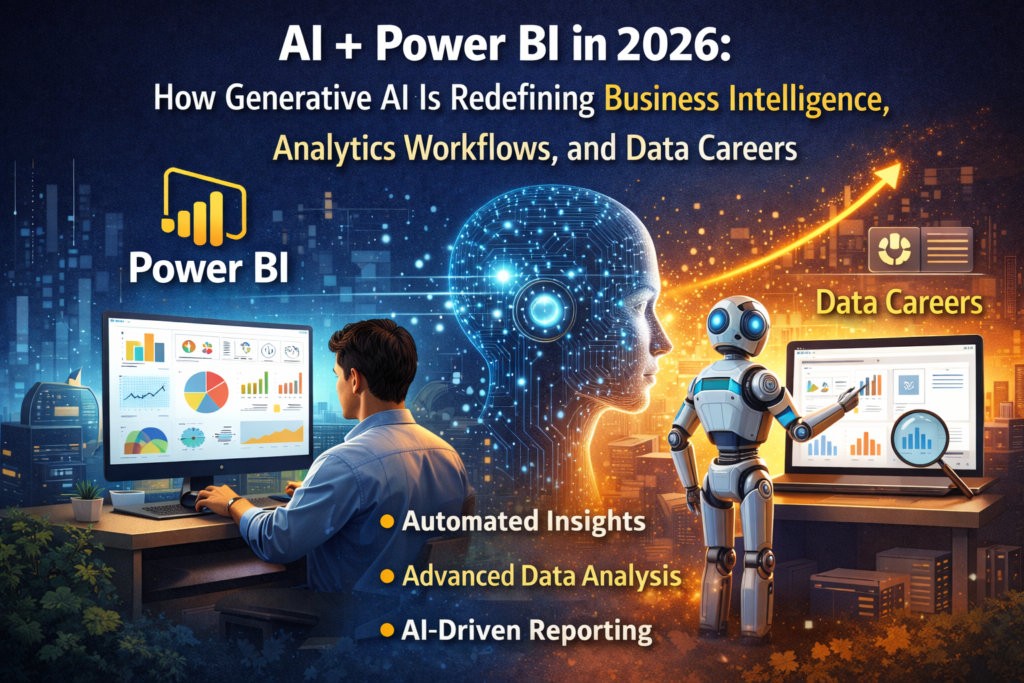
AI-powered Power BI dashboard in 2026 showing Generative AI insights, Microsoft Copilot assistance, anomaly detection, predictive analytics, and conversational reporting interface.
blogs

AI + Power BI in 2026: How Generative AI Is Redefining Business Intelligence, Analytics Workflows, and Data Careers

Introduction: Business Intelligence Is No Longer Just About Dashboards For many years, business intelligence meant building reports, creating visualizations, and presenting KPIs to decision-makers. Tools like Power BI became central to corporate reporting environments. Data analysts focused on modeling datasets, writing DAX formulas, optimizing performance, and designing executive dashboards. That era is not over. But it is evolving rapidly. In 2026, Artificial Intelligence  especially Generative AI  is transforming how business intelligence functions inside organizations. Power BI is no longer just a visualization tool. It is becoming an intelligent analytics assistant capable of suggesting insights, generating summaries, identifying anomalies, and interacting conversationally with users. The shift is not small. It changes: This article explains in depth how AI is integrated into Power BI, how Generative AI is reshaping workflows, how Microsoft Copilot operates inside the platform, what risks exist, and what data professionals must do to stay relevant. What AI Integration in Power BI Actually Means in 2026 When people hear “AI in Power BI,” they often imagine automatic chart suggestions or simple smart features. However, the integration is much deeper than that. AI in Power BI operates across multiple layers of the analytics lifecycle. At the interaction level, users can now communicate with reports using natural language. Instead of manually navigating filters, they can ask specific business questions and receive structured responses. At the insight level, AI algorithms analyze data patterns to detect anomalies, correlations, seasonality, and trends that may not be obvious to human analysts. At the development level, Copilot assists in writing DAX measures, creating calculated columns, generating model explanations, and even suggesting optimized visual layouts. At the executive level, AI generates narrative summaries of dashboards, translating technical metrics into business-friendly explanations. This multi-layer integration changes the role of Power BI from static reporting software into an intelligent collaboration tool between humans and machines. Understanding Generative AI in Business Intelligence Generative AI is different from traditional analytics automation. Traditional BI automation focused on rule-based triggers. For example, if revenue drops below a threshold, an alert is generated. These systems followed predefined logic. Generative AI, however, can interpret context and generate new content based on patterns in data. In Power BI, this includes generating written summaries of performance reports, suggesting possible explanations for metric changes, and even proposing additional visualizations to explore deeper insights. For instance, if quarterly sales show unexpected growth in a specific region, Generative AI may highlight that region automatically and suggest potential contributing factors based on related metrics. This does not eliminate the need for human validation. Instead, it reduces time spent manually exploring data. Generative AI acts as a data exploration accelerator. Microsoft Copilot in Power BI: Practical Impact on Daily Work Microsoft Copilot has become a significant component of Power BI in 2026. Its role is not to replace analysts, but to enhance productivity and reduce repetitive work. Copilot assists by translating plain language instructions into DAX measures. For example, instead of manually writing complex time-intelligence formulas, analysts can describe the requirement conversationally, and Copilot generates a draft formula. It also helps interpret complex data models by explaining relationships between tables, calculated measures, and filters in simple language. This is especially valuable for new team members trying to understand large enterprise models. For executives, Copilot can generate executive summaries of dashboards. Instead of reviewing dozens of charts, leaders receive structured written insights that explain performance trends. This significantly shortens analysis cycles and improves communication between technical and non-technical stakeholders. However, Copilot is not perfect. It requires human review, especially when dealing with complex models. How AI Is Reshaping the Role of Data Analysts Before AI integration, the workflow of a Power BI analyst was heavily manual. Data cleaning required constant checking. Model optimization required trial and error. Insight generation required manual exploration. Executive reporting required written explanations prepared separately. In 2026, many of these steps are partially automated. Analysts now spend less time writing repetitive formulas and more time validating AI-generated suggestions. Instead of manually scanning for anomalies, they review AI-detected insights and investigate business implications. The role shifts from technical executor to strategic validator. Analysts must now develop stronger contextual thinking skills. They must understand business processes deeply because AI tools generate possibilities, but humans decide relevance. This elevates the role rather than diminishes it. Enterprise Use Cases: Real-World Impact of AI + Power BI Large enterprises are already using AI-powered BI in several critical areas. In sales analytics, predictive models forecast revenue trends based on historical patterns and market indicators. AI highlights potential underperforming segments before they become severe problems. In supply chain management, AI monitors operational data streams and flags unusual variations in delivery timelines or inventory levels. In finance departments, anomaly detection algorithms automatically flag suspicious expense patterns or unusual cost spikes. In executive reporting, Generative AI produces summarized insights for board-level discussions, reducing preparation time dramatically. These applications demonstrate that AI in Power BI is not theoretical. It is operational. Limitations and Governance Concerns Despite the power of AI integration, there are risks. AI outputs depend entirely on the quality of input data. If data models are poorly structured or incomplete, AI-generated insights may be misleading. There is also a risk of over-reliance. Analysts must critically evaluate AI suggestions rather than accepting them blindly. Governance frameworks must be strengthened to ensure data privacy, ethical usage, and transparency in AI-generated decisions. Enterprises adopting AI-powered BI must invest in both technology and oversight. Career Implications for 2026 and Beyond Data professionals who embrace AI tools increase their productivity and strategic value. However, professionals who rely only on AI without understanding underlying logic risk becoming dependent rather than skilled. The future belongs to analysts who combine: AI is not replacing careers. It is redefining expectations. Frequently Asked Questions   Is AI in Power BI fully automated, meaning no human input is required? AI in Power BI significantly reduces manual effort, but it does not eliminate human involvement. Analysts must validate AI-generated insights, ensure data quality, and interpret business implications. AI

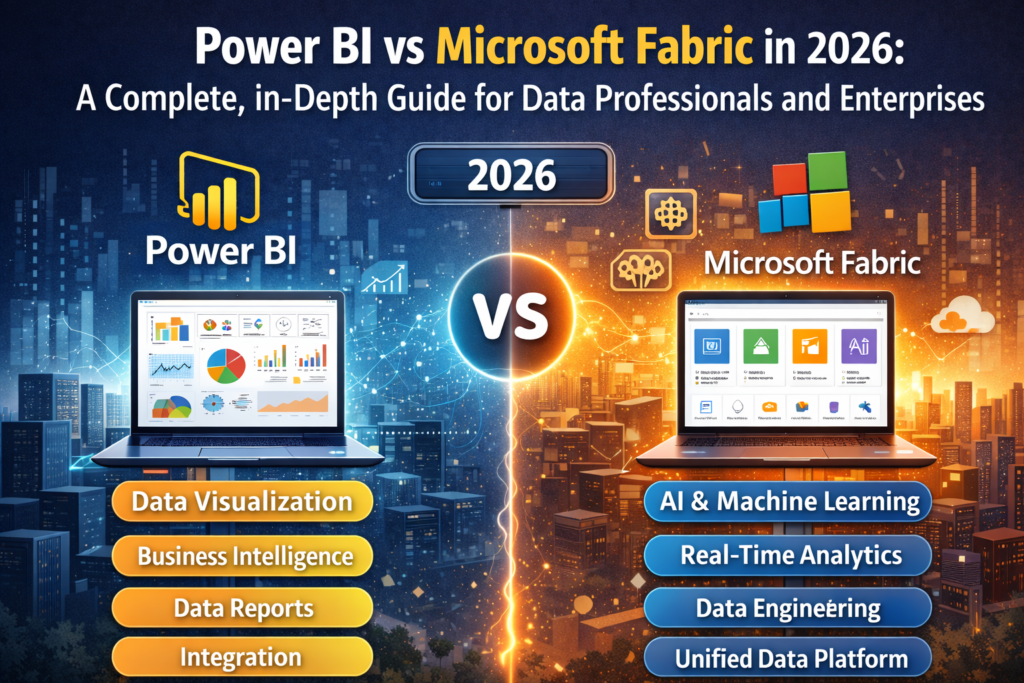
Comparison of Power BI and Microsoft Fabric in 2026 showing presentation layer vs full data ecosystem, including OneLake, lakehouse architecture, AI integration, and enterprise analytics.
blogs

Power BI vs Microsoft Fabric in 2026: A Complete, In-Depth Guide for Data Professionals and Enterprises

Introduction: Why This Debate Is Growing in 2026 The discussion around Power BI and Microsoft Fabric is not just a technical comparison. It reflects a major shift in how enterprises approach data analytics. For more than a decade, Power BI has been one of the most trusted business intelligence platforms in the world. Thousands of organizations built their reporting ecosystems around it. Many professionals built entire careers mastering DAX, modeling, and dashboard optimization. However, in 2026, enterprise expectations have evolved. Companies no longer want isolated reporting tools. They want unified analytics platforms that combine data storage, transformation, governance, AI integration, and reporting into a single, scalable system. This is where Microsoft Fabric changes the conversation. Many professionals are asking: Is Microsoft Fabric replacing Power BI?Should I stop learning Power BI?Is Fabric only for engineers?What will companies prefer in the future? To answer these questions properly, we must go beyond surface-level comparisons and understand architecture, enterprise strategy, career direction, and long-term data transformation trends. This blog explains everything in depth. Understanding Power BI in 2026: Its True Role Today Power BI in 2026 is far more advanced than it was a few years ago. It is not just a dashboard tool anymore. It includes AI-powered insights, Copilot assistance, enhanced security features, and enterprise-grade deployment options. At its core, Power BI specializes in turning structured data into understandable business insights. It focuses on modeling data, creating relationships, writing DAX measures, optimizing performance, and building interactive reports that executives can use for decision-making. The strength of Power BI lies in its ability to simplify complexity. It translates raw numbers into stories that business leaders can understand. However, despite its strength in reporting and modeling, Power BI does not fully manage the entire data lifecycle. It typically connects to external storage systems, data warehouses, or data lakes. It consumes data rather than controlling the infrastructure behind it. This distinction becomes important when comparing it with Microsoft Fabric. Understanding Microsoft Fabric: A Platform, Not Just a Tool Microsoft Fabric is not designed as a replacement for Power BI. It is designed as a unified analytics ecosystem. Fabric brings together multiple capabilities that were previously separated across different Microsoft services. It includes data engineering tools, data pipelines, lakehouse architecture, warehouse capabilities, real-time analytics, AI integration, and business intelligence — all within one platform. One of its most important components is OneLake, which acts as a centralized storage layer. Instead of storing data across disconnected systems, enterprises can manage everything in a unified environment. This fundamentally changes how organizations think about analytics. Instead of asking, “How do we build a dashboard?” enterprises now ask, “How do we design a complete data system that supports dashboards, AI, governance, and scalability?” Fabric operates at system level, not just visualization level. The Architectural Difference: Presentation Layer vs Full Data Ecosystem To truly understand the difference, imagine a building. Power BI is like the interior design of the building. It makes the information inside beautiful, understandable, and usable. It focuses on how insights are presented to decision-makers. Microsoft Fabric is the entire building structure. It includes the foundation, wiring, plumbing, security systems, storage rooms, and architecture. Power BI answers the question:“What insights can we see?” Microsoft Fabric answers:“How is the entire data system structured, governed, stored, processed, and delivered?” In enterprises that are growing rapidly, architecture becomes as important as presentation. Why Enterprises Are Moving Toward Fabric Enterprise data environments have become more complex. Organizations handle: Managing all this through disconnected services creates cost and inefficiency. Fabric simplifies this by unifying services into a single experience. This does not eliminate Power BI. It strengthens it by embedding it inside a larger architecture. Enterprises prefer integration over fragmentation. That is why Fabric adoption is growing. Career Impact: What This Means for Power BI Professionals For data professionals, this shift is significant. If you remain focused only on visualization and DAX modeling, your skills remain valuable. Many organizations still need strong Power BI specialists. However, professionals who expand into Fabric architecture gain broader influence. They understand: This positions them closer to decision-making and system design roles. In 2026, hybrid professionals are more competitive than specialists in isolated tools. Power BI knowledge remains the foundation. Fabric knowledge becomes the multiplier. When Power BI Alone Is Enough Not every organization requires full Fabric architecture. Small businesses and teams focused mainly on reporting may not need advanced data engineering systems. In such environments, Power BI continues to serve effectively. If your organization operates with limited data complexity, Power BI may remain sufficient. However, as companies grow and data complexity increases, system-level thinking becomes necessary. When Fabric Becomes Essential Fabric becomes critical when organizations: In these cases, Power BI alone is not enough. The broader ecosystem matters. Fabric aligns with long-term enterprise digital transformation. Is Microsoft Fabric Replacing Power BI? This is one of the most misunderstood topics. Microsoft Fabric is not replacing Power BI. It includes it. Power BI remains the reporting engine within Fabric. Your DAX skills, modeling knowledge, and visualization expertise do not become useless. Instead, they operate within a larger system. The shift is not elimination.It is integration. Professionals who understand this nuance will navigate the transition successfully. The Future of Business Intelligence in 2026 and Beyond The future of analytics is not tool-based. It is ecosystem-based. Business intelligence is evolving into integrated data intelligence. Visualization remains essential, but architecture and AI integration become equally important. Power BI continues as the visualization powerhouse.Microsoft Fabric represents the unified analytics backbone. Professionals who understand both layers will shape the future of enterprise data. Frequently Asked Questions   Is Microsoft Fabric better than Power BI? It is incorrect to say Fabric is better than Power BI. They serve different purposes. Power BI excels in reporting and data visualization. Fabric encompasses a much broader scope that includes engineering, storage, governance, and AI. Comparing them directly without context creates confusion. Fabric is an expansion of capabilities, not a superior replacement. Should I stop learning Power BI and

Trust Us, One Call Can Make a Difference
Please enable JavaScript in your browser to complete this form.
Join As Trainer
Join As Trainer
Please enable JavaScript in your browser to complete this form.
Download Course Content
Please enable JavaScript in your browser to complete this form.
More than 5 People are attending Get On a Call with Us
Please enable JavaScript in your browser to complete this form.
More than 5 People are attending Get On a Call with Us
Scroll to Top